| Info |
|---|
|
This page provides an overview of the default appearance and components of the Embedded Management Application (EMA) user interface. Individual users can see a different appearance based on customization, deployment model, or user group. |
By default after logging in, the EMA home page opens with the EMA Dashboard as your starting point. The Dashboard provides system status information and links to helpful tools and online help information.
This page provides an overview of the common elements you find within the EMA user interface followed by a description of the Dashboard component. The following figure shows an example of a default home page after login, including the Dashboard component and illustrating the common elements
| Note |
|---|
The default Dashboard screen displays upon successful login.
| Caption |
|---|
| 0 | Figure |
|---|
| 1 | Default EMA Default GUIWindow |
|---|
|
 Image Modified Image Modified
|
The | Spacevars |
|---|
|
EMA Main screen is divided into following: |
The default EMA home page provides a Live Monitor link so you can immediately open the Live Monitor window to access real-time monitoring and historical performance data for a wide range of SBC metrics. Refer to Home - Live Monitor for more information. |
Common EMA Elements
Windows within EMA contain common elements at the top and on the left to enable navigation and to provide access to system-level information and commonly-used tools.
Top
Status Bar
| Caption |
|---|
| 0 | Figure |
|---|
| 1 | Status EMA Top Bar |
|---|
|
 Image Modified Image Modified
|
The EMA top bar area contains the following common elements from left to right:
EMA Status Bar consists of:- Classic workspace (default) provides access to all options within EMA for users with sufficient privileges. Other workspaces provide a subset of options tailored for a specific task category such as troubleshooting or configuration. An administrator can customize which workspaces are available to different user groups as well as create and assign custom workspaces. For more information, refer to Users and Application Management - Workspace Settings.
- System status data widget: This widget provides the number of current Active Calls and the number of Licensed Sessions. These metrics are updated every 15 seconds.
- Alarms widget: This widget provides a color-coded summary of the number of currently active
- System Status Monitor tab: This tab provides useful information such as number of current Active Calls and the Current Licensed Session number.
- Alarms Monitor tab: This tab provides vital information about the number of Critical, Major, Minor and Informational alarms currently triggered from application.. The alarm data is updated every 15 seconds. Click on the widget to go directly to the Current Alarm List.
- System and software information widget: This widget provides the name of the server/node, the version of theInstall Info tab: This tab provides the name of the application application currently opened, and the Node Serial Number of current session. The node serial number. This serial number will is also be printed in the headers of Call Tracecall trace, Debugdebug, and .SYS logs.
Navigation - .
- User and Help tool bar: This area displays the ID of the logged in user. Hover your mouse pointer over the user ID and menu options appear for changing the user password or logging out. Hover your mouse pointer over the ? (question mark) and menu options appear as in the following figure:
 Image Added
- Click Documentation to open the EMA User Guide table of contents.
- Click the specific help topic title (example: Sip SigPort Help) for help on the current window.
- Click Add Custom Help Topic to add your own custom help information. Refer to Custom Help Links.
- Search: The search option lets you search for objects or windows by name. A pop-up window provides links to instances of the search term located within the EMA UI. The search option applies to all perspectives.
| Caption |
|---|
| 0 | Figure |
|---|
| 1 | Navigation EMA Menu Bar |
|---|
|
 Image Modified Image Modified
|
Consists of menus to perform the common operationsWindows within EMA are organized by major user task (such as "Administration" or "Configuration") and by sub-tasks within the major categories (such as "System Administration" or "Traps and SNMP"). Use the main menu and sub-menus to navigate to windows within a selected task category and a selected sub-task. Click on a menu to view the its sub-menus.
Sub-Navigation
BarTree
| Caption |
|---|
| 0 | Figure |
|---|
| 1 | Sub-Navigation BarLeft Pane |
|---|
|
 Image Modified Image Modified
|
Displays all the Your choice of menu and sub-menus for each main menu listed in the Navigation Menu Bar.Also, towards the right hand side of the Sub-Navigation Bar, the following links are provided:menu options determines which windows appear in the navigation tree on the left side of EMA. In the preceding figure, the navigation tree contains windows for Administration tasks that are specific to Users and Application Management. Windows are arranged hierarchically. Use the arrows on the left of the tree to expand and collapse the list.
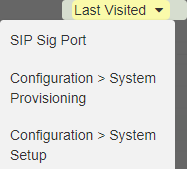
Last Visited
Click Last Visited to retrieve a list of links to EMA windows you have opened recently.
Sub-Navigation Pane 2 |  Image Removed Image Removed
|
- Log out—Click Log out to log out from the EMA.
- Help—Click Help to view the online help.
|
 Image Added Image Added
|
| Anchor |
|---|
| EMA Dashboard |
|---|
| EMA Dashboard |
|---|
|
EMA DashboardLeft PaneThe EMA Dashboard provides quick access to system status and links to information to help you get started working with the SBC and to use the EMA user interface effectively. The Dashboard can be customized by each individual EMA user. Any changes made are associated with that specific user and persist from session to session.
Left Pane |
 Image Modified Image Modified
|
Search Functionality
The Search option in this panel provides the ability to search for objects by name. This search option applies to all perspectives.
Expand and Collapse Objects
Click Expand All to expand all the objects at once to display its sub objects for a particular sub-menu option. Once expanded, click Collapse All to move back to its original display.
| Note |
|---|
The above example is the default view, and the content changes according to the menu selections. |
The Dashboard is divided into five panels:
Getting Started with the SBC - Click the text link or the image to open the Visual First Call Setup window. This window helps you complete the basic configuration needed to successfully establish the first call. Refer to Configuration Wizards - Visual First Call Setup for more information.
| Info |
|---|
|
The "Getting Started with the SBC" panel is automatically hidden once the "First Call Setup" completes. Go to "Dashboard Settings" to re-enable the panel. |
SBC Workflows - Click on the links in this panel to access workflows for some common SBC configuration tasks or to access the area where all workflows are listed and new workflows can be created. Refer to Configuration Workflows and Templates for more information.
Quick Help - Click the links in this panel to access online help for the specified topic or click the Go to Help link to open the table of contents for the EMA User Guide.
System Status - This panel provides status on a variety of SBC system parameters. The values are updated when the window opens and the refresh button reloads the latest status. Values are color coded:
- Green - Enabled / Status Up
- Red - Enabled / Status Down
- Yellow - Standby (Policy Server)
- Gray - Disabled
Click Go to System Status for additional status information from the System Status window. Refer to Dashboard - System Status for more information.
Favorite Pages - Use the links in this panel as shortcuts to the pages you designated as favorites in Dashboard Settings. See the following section for information on customizing the Dashboard.
Customizing the Dashboard
To customize the appearance of the Dashboard and create Favorite Pages links:
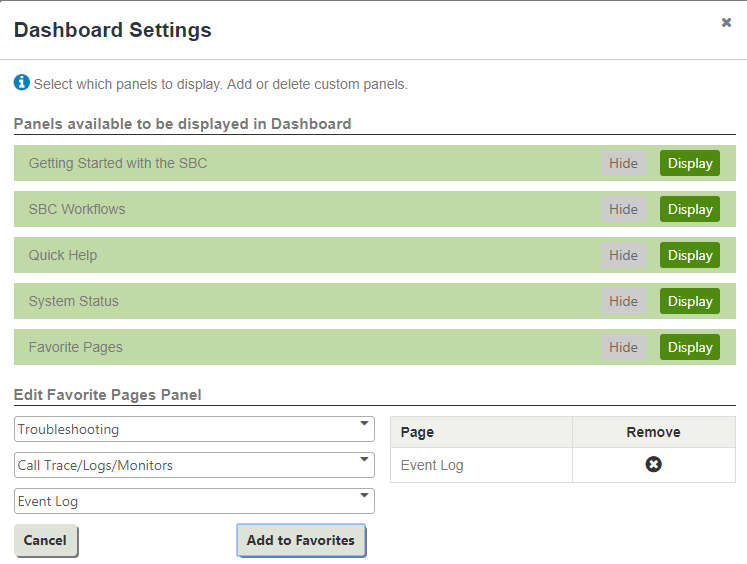
- Click Dashboard Settings. The Dashboard Settings pop-up window opens.
- Click on the Hide and Display buttons adjacent to the panel names to toggle between showing or hiding the panels within the Dashboard.
- Under Edit Favorite Pages Panel, use the drop-down lists to sequentially select the menu, sub-menu (if applicable), and the specific window name to add a favorite page. In the following figure, the example shows first selecting the Troubleshooting menu, then the Call/Trace/Logs/Monitors sub-menu, and finally Event Log. After clicking Add to Favorites, a link to the Event Log is added to Favorite Pages on the Dashboard.
- Remove pages you no longer want to link as Favorite Pages by clicking the X adjacent to the page name.
- Close the pop-up window and apply your changes by clicking the X in the upper right-hand corner.
| Caption |
|---|
| 0 | Figure |
|---|
| 1 | Dashboard Settings Window |
|---|
|
 Image Added Image Added
|

